


Introduction
QGIS, an open-source Geographic Information System, provides powerful tools for spatial data visualization and analysis. Integrating Detekt's detection results, such as GeoTIFFs and shapefiles, into QGIS enhances your analytical capabilities and streamlines your workflow. This guide will walk you through the steps to achieve this integration.
The Need for Integration
In many applications, GIS users need to incorporate data from various sources to create a comprehensive analysis. Detekt provides valuable data that can enhance GIS analyses and by integrating Detekt’s detection results, such as GeoTIFFs and shapefiles, into QGIS, users can take advantage of QGIS’s powerful tools to further analyze and visualize this data.
GeoTIFFs and Shapefiles provided by Detekt
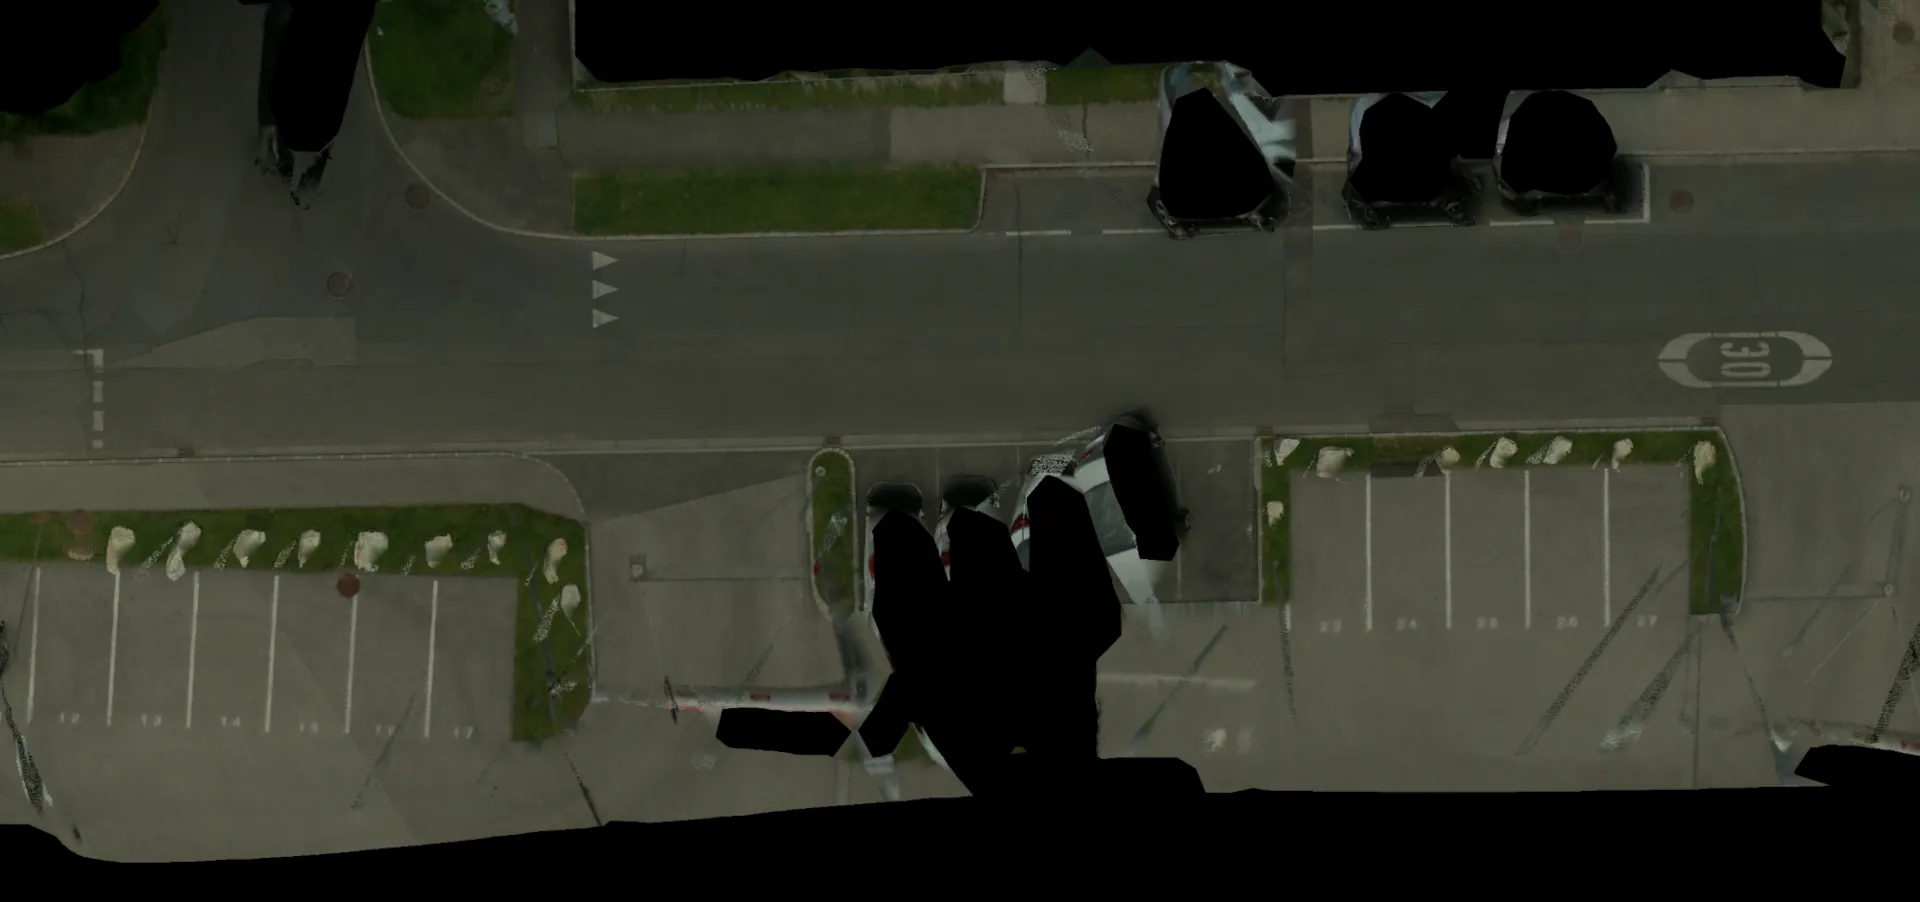
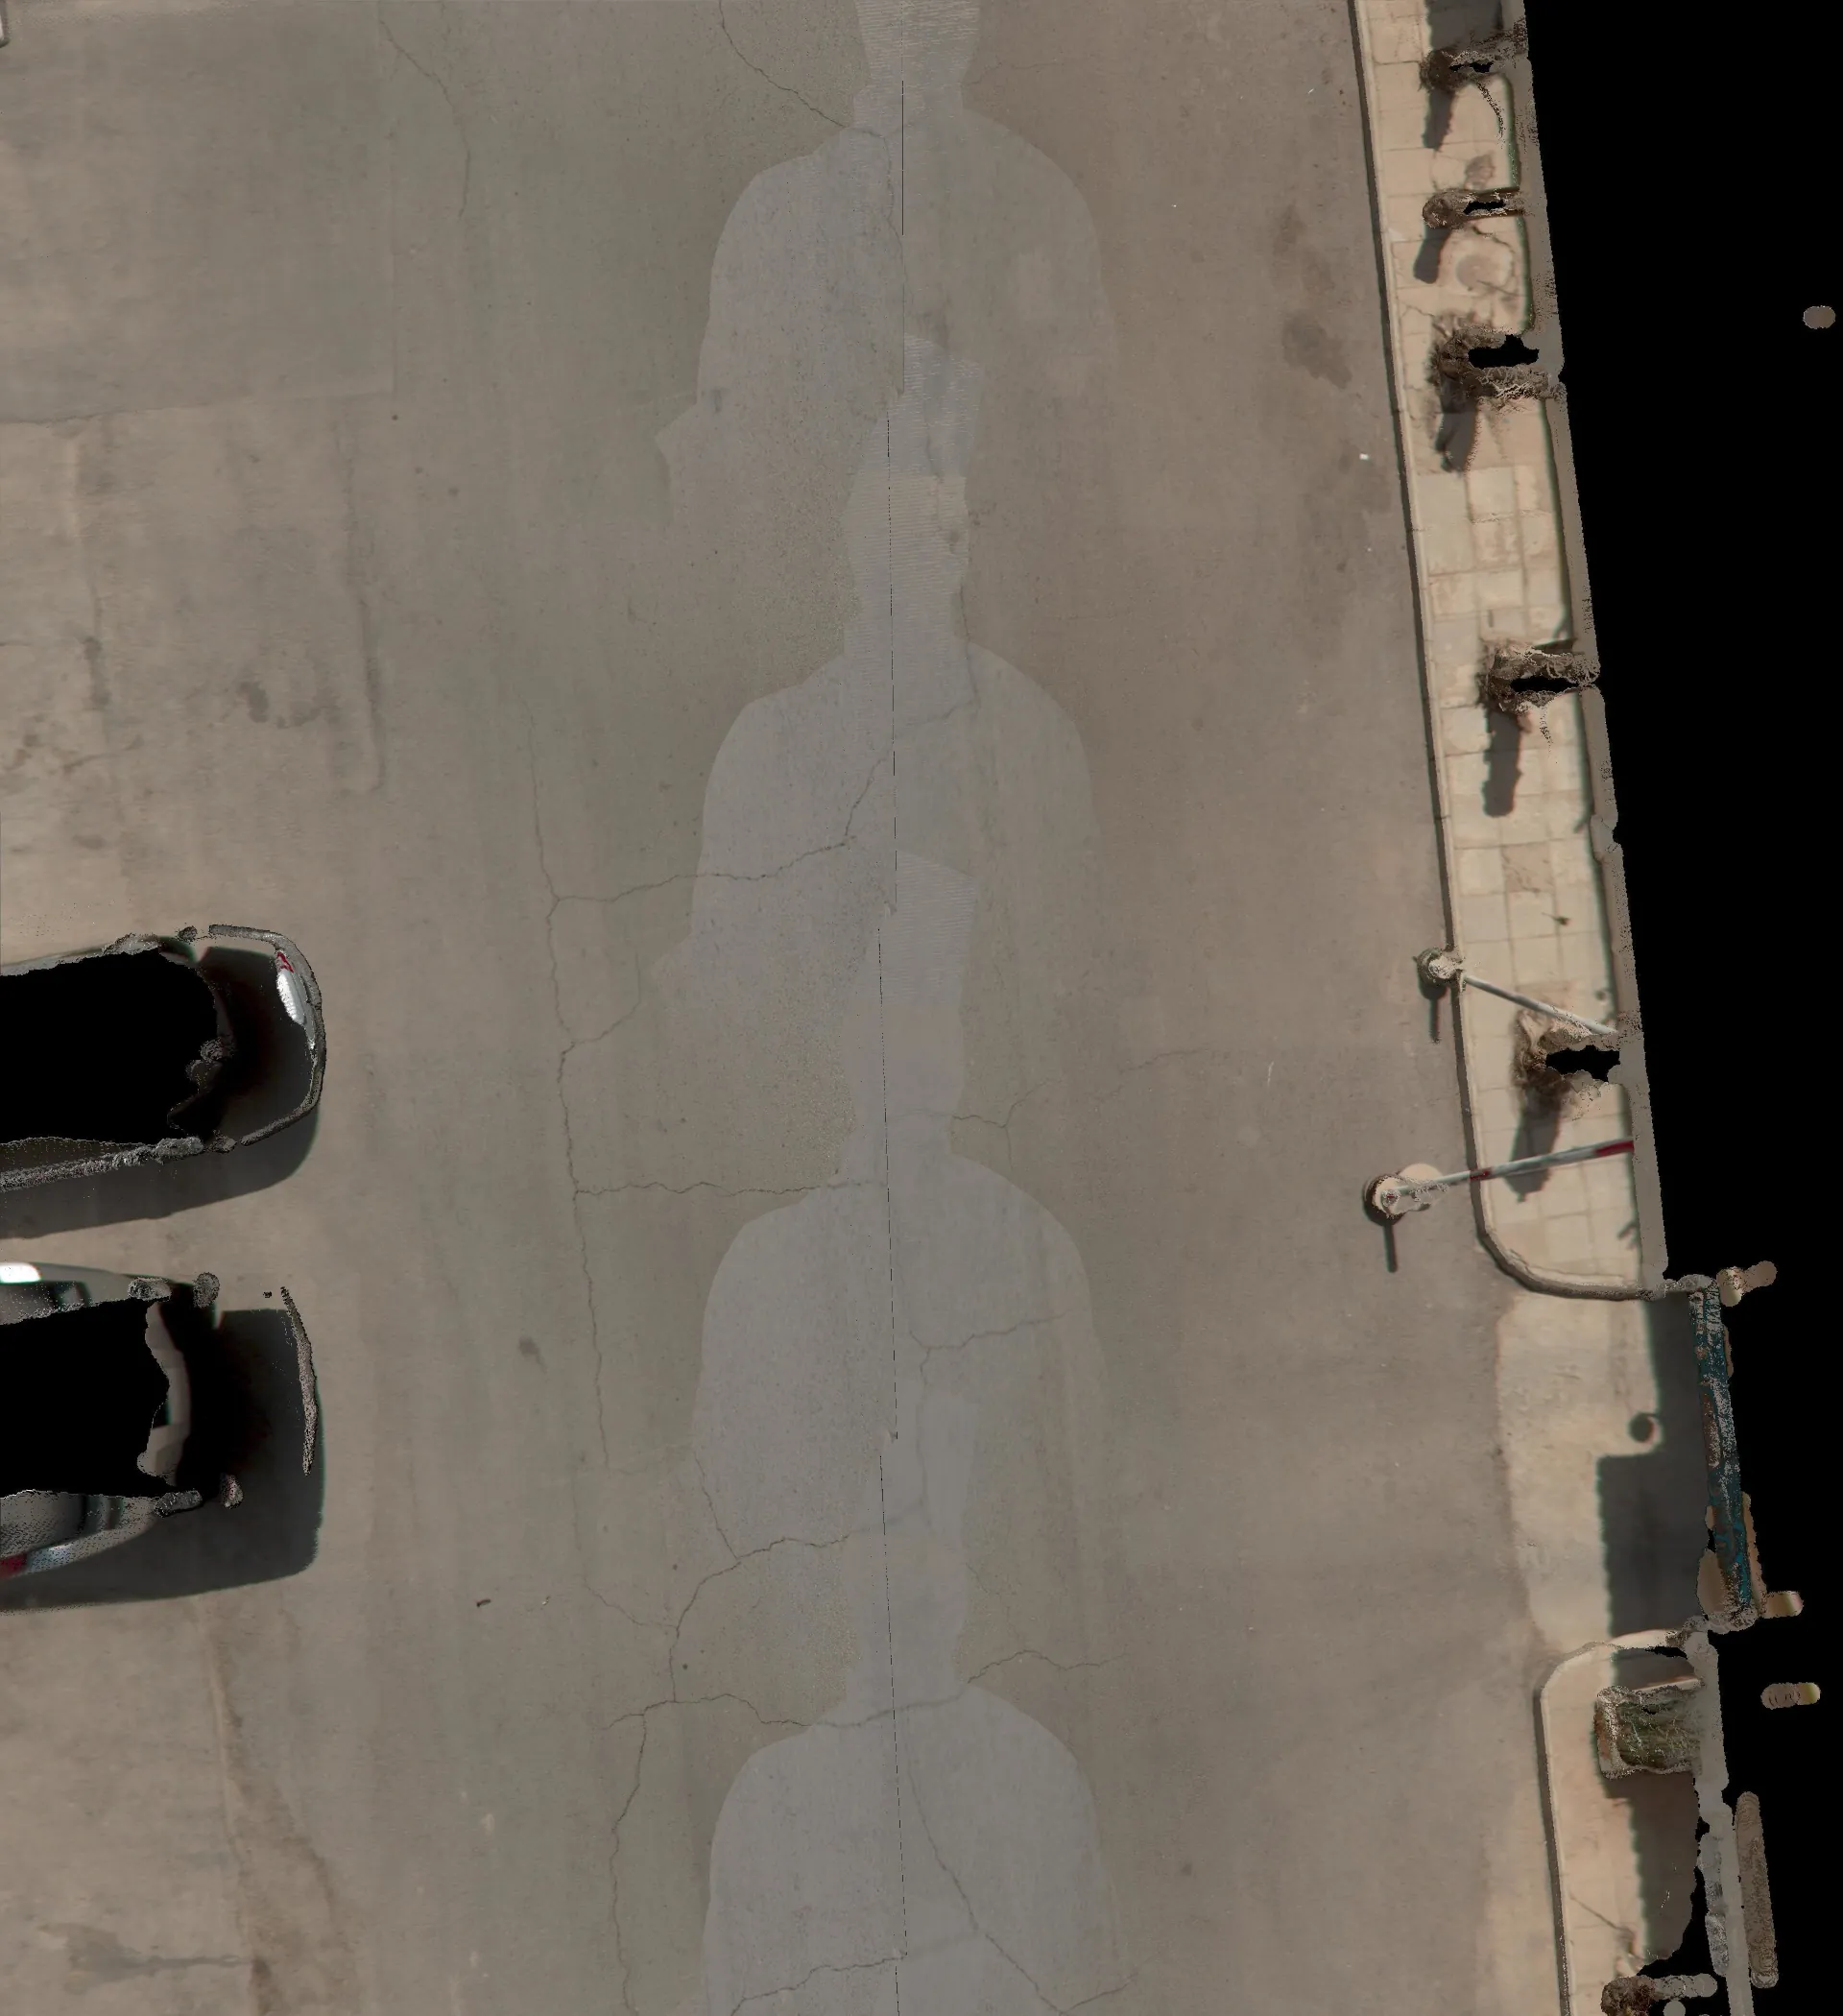
- GeoTIFFs: These are raster files that store georeferenced data, making them ideal for representing spatial phenomena like satellite imagery, elevation models, and land cover data. QGIS’s raster capabilities allow users to perform operations such as reclassification, resampling, and raster algebra on GeoTIFFs. With Detekt, we are able to create GeoTIFFs from Mobile Mapping image data to visualize roads from an orthogonal perspective.
- Shapefiles: These vector data formats are widely used for storing geometric locations and attribute information. They are versatile for a range of applications, including mapping, network analysis, and spatial statistics. QGIS handles shapefiles effortlessly, offering tools for editing, querying, and analyzing vector data. All detections made by Detekt, such as road damages, road markings, and road signs, can be exported as Shapefiles.
How to integrate Detekt data in QGIS?
Integrating Detekt's detection results into QGIS is more than just combining datasets; it’s about leveraging the strengths of both platforms to achieve a more thorough and insightful analysis. Detekt provides high-quality, precise detection data, while QGIS offers extensive tools for spatial analysis and visualization.
This guide will walk you through the steps required to import detection results and GeoTIFFs created with Detekt into QGIS, ensuring that you can fully utilize the capabilities of both platforms.
Before you begin, please contact the Detekt team and request that GeoTIFFs and shapefiles be included in the final deliverables.
Step 1: Importing GeoTIFFs into QGIS
1.1 Launch QGIS
Open QGIS on your computer. If you haven't installed QGIS yet, download and install it from the official QGIS website.
1.2 Add GeoTIFF Layer
- In QGIS, go to the 'Layer' menu and select 'Add Layer' > 'Add Raster Layer...'.
- In the 'Add Raster Layer' dialog, click 'Browse' and navigate to the location where you saved your GeoTIFF file.
- Select the GeoTIFF file and click 'Open'.
- Click 'Add' to import the GeoTIFF into QGIS.
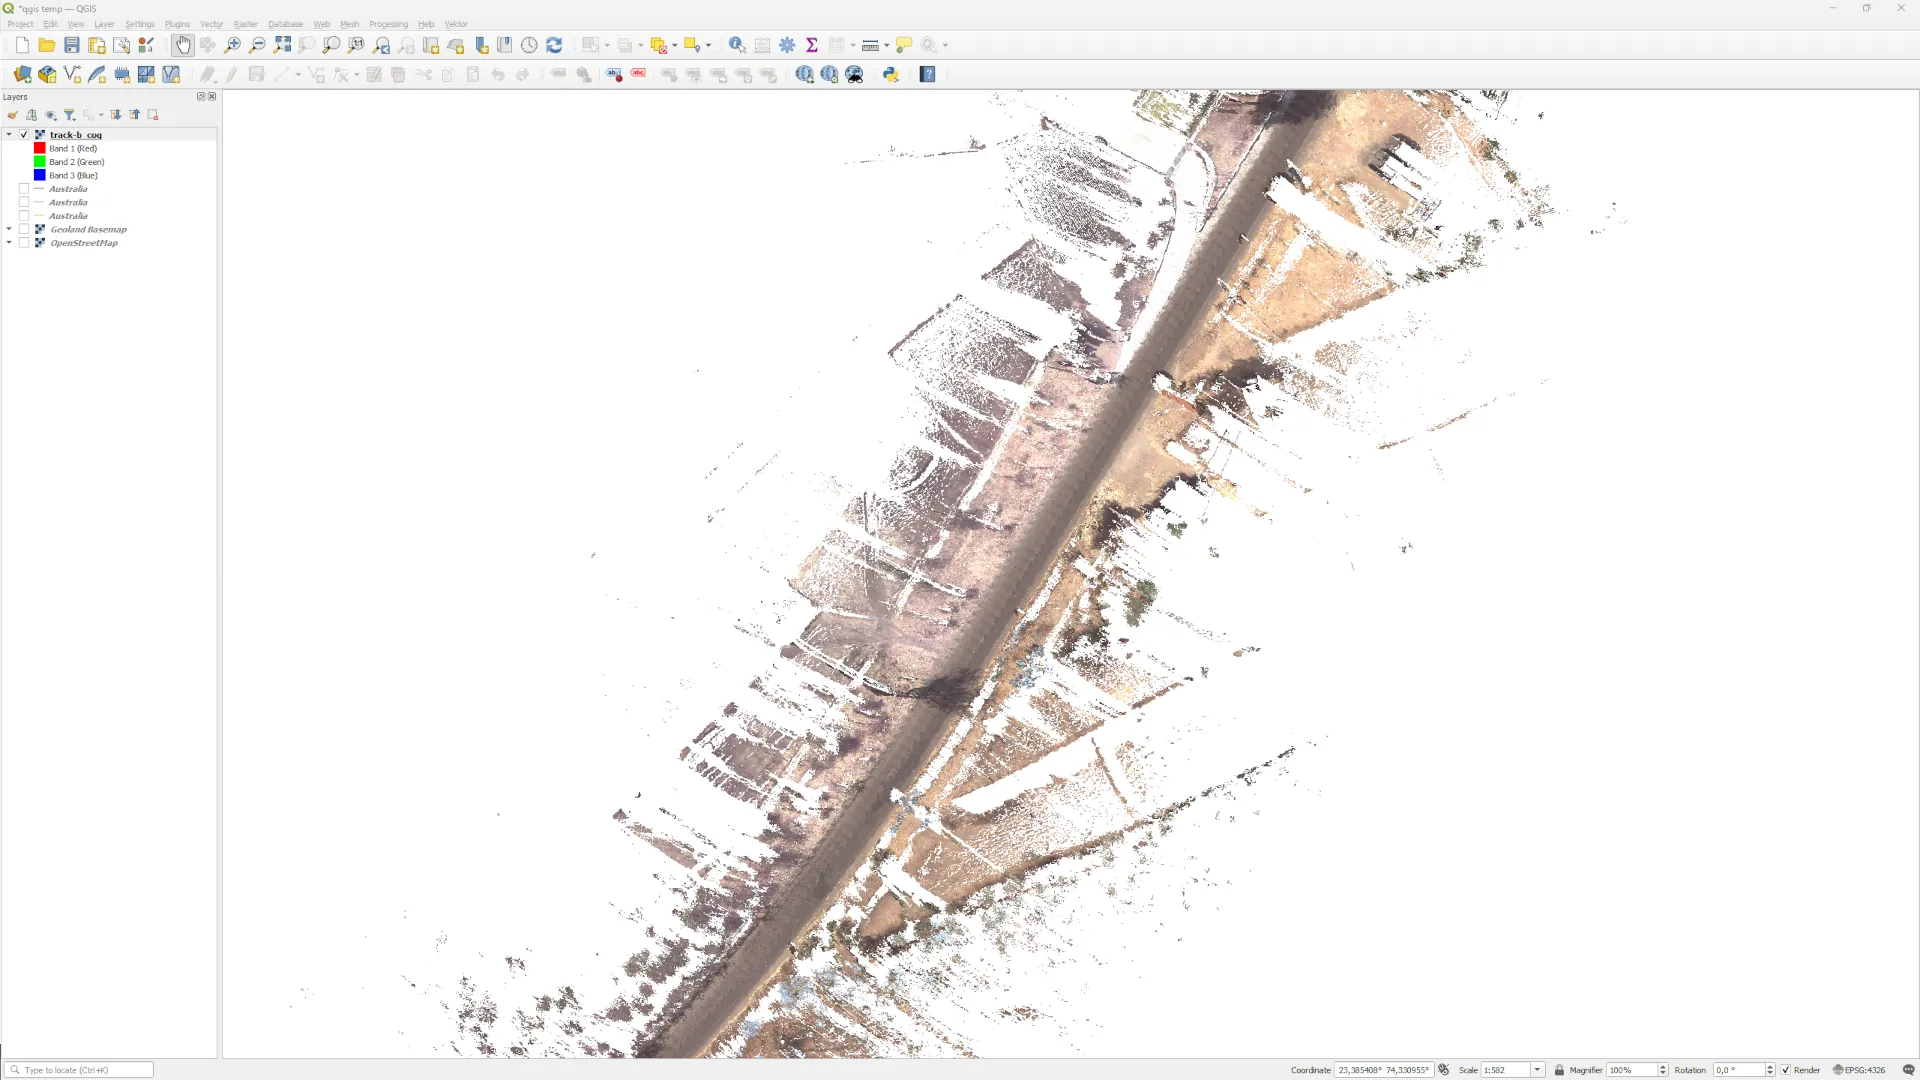
Your GeoTIFF should now be visible on the QGIS canvas. You can use QGIS tools to adjust the visualization, analyze the raster data, and integrate it with other layers.
Step 2: Importing Shapefiles into QGIS
2.1 Add Shapefile Layer
- In QGIS, go to the 'Layer' menu and select 'Add Layer' > 'Add Vector Layer...'.
- In the 'Add Vector Layer' dialog, click 'Browse' and navigate to the location where you saved your shapefile (.shp).
- Select the .shp file and click 'Open'.
- Click 'Add' to import the shapefile into QGIS.
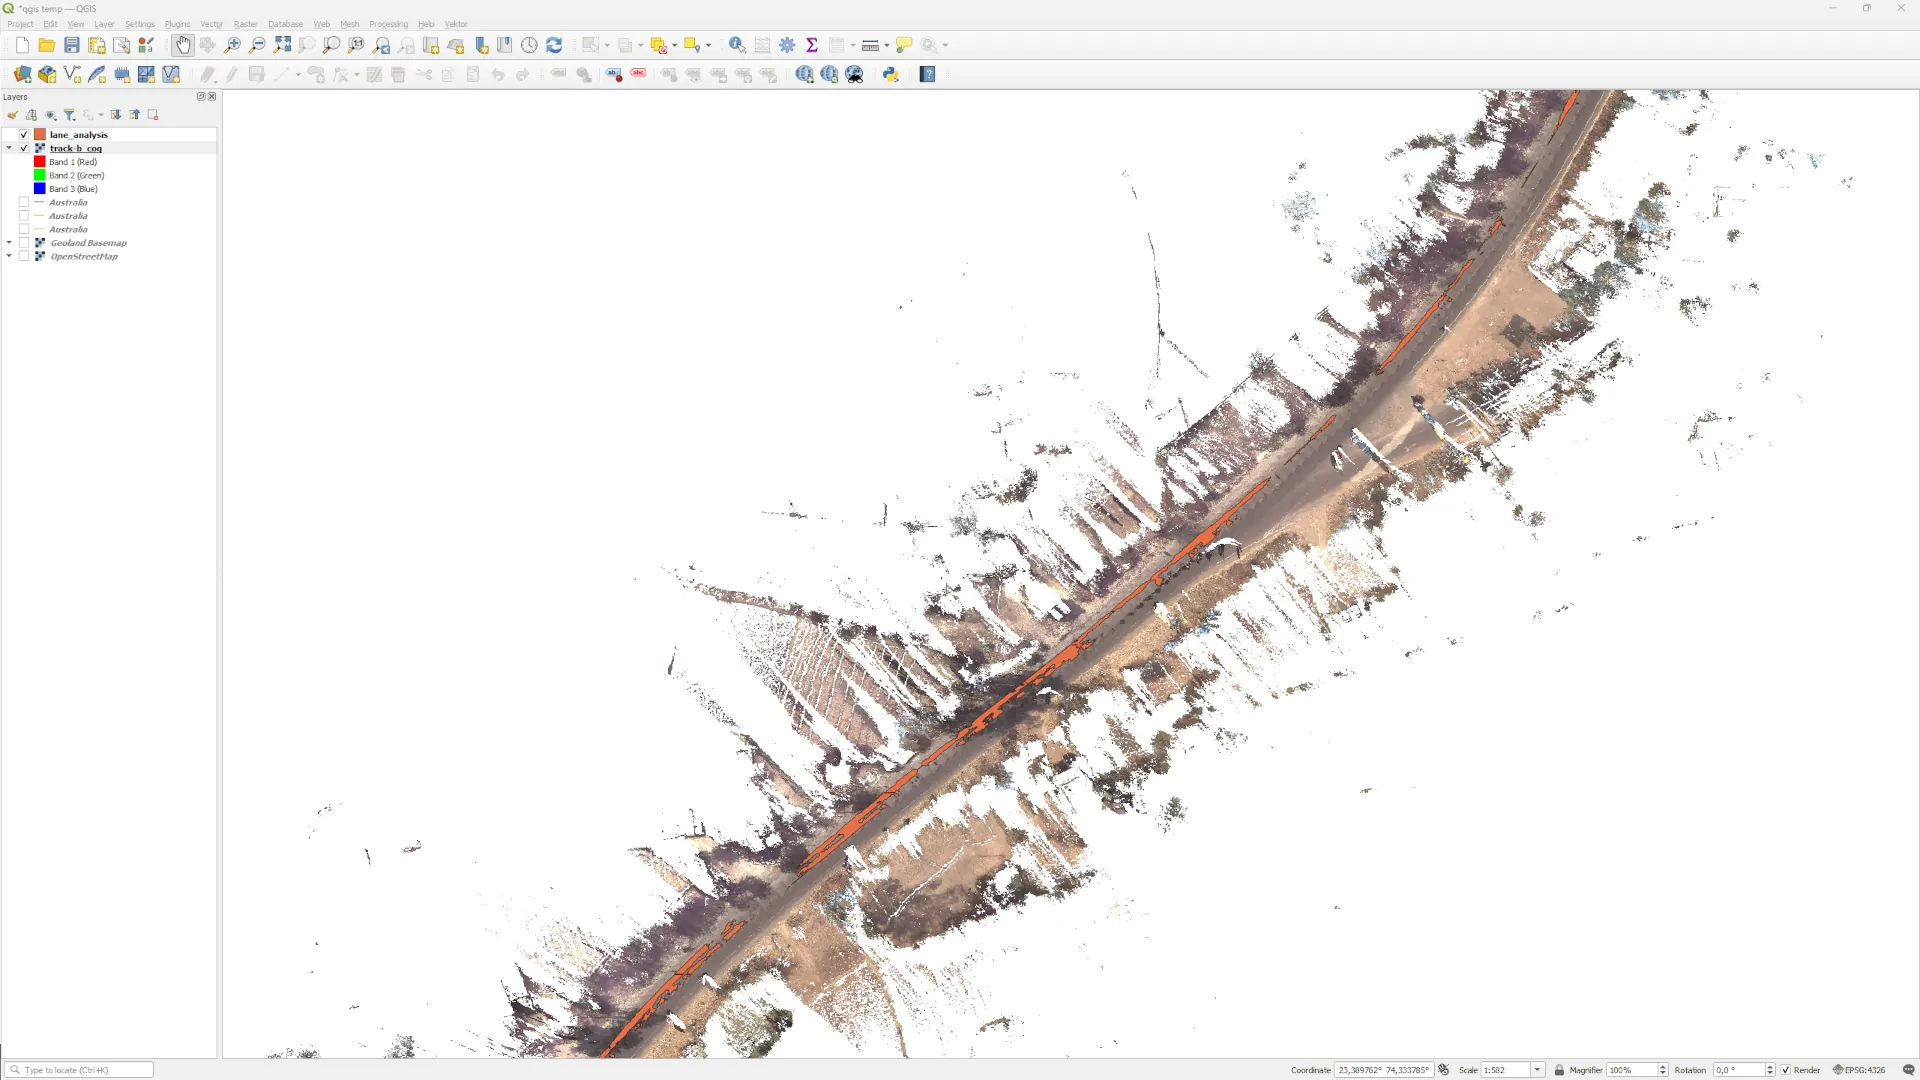
Your shapefile should now be visible on the QGIS canvas. You can use QGIS tools to analyze the vector data, perform spatial queries, and integrate it with other layers.
Step 3: Visualizing and Analyzing Integrated Data
3.1 Styling Layers
QGIS offers extensive styling options to enhance the visualization of your data:
- Right-click on the layer (GeoTIFF or shapefile) in the Layers panel.
- Select 'Properties' to open the Layer Properties dialog.
- Navigate to the 'Symbology' tab.
- Adjust the style settings to visualize your data effectively.
3.2 Analyzing Data
Leverage QGIS's analytical tools to gain insights from your integrated data:
- Use the 'Processing Toolbox' to access a variety of geoprocessing tools.
- Perform spatial analyses such as buffering, intersecting, and clipping to derive new information from your data.
- Create maps and reports to share your findings with stakeholders.
Conclusion
Integrating detection results from Detekt into QGIS empowers you with advanced tools for spatial data analysis and visualization. By following the steps outlined in this guide, you can seamlessly import GeoTIFFs and shapefiles from Detekt into QGIS, enabling you to enhance your existing Mobile Mapping projects. With QGIS's robust capabilities, you can visualize, analyze, and share your data more effectively, driving better decision-making and outcomes.


.svg)
